
Data control step
The aim of the data control step is to detect errors in the four data tables and possibly correct them if possible.
Data check
During this step, the first action to do is launching global check, by clicking on the Check data button.
Coser will check:
line by line for errors in each of the 4 tables
verification by cross-checking files
verification by cross-checking with the taxonomic reference file
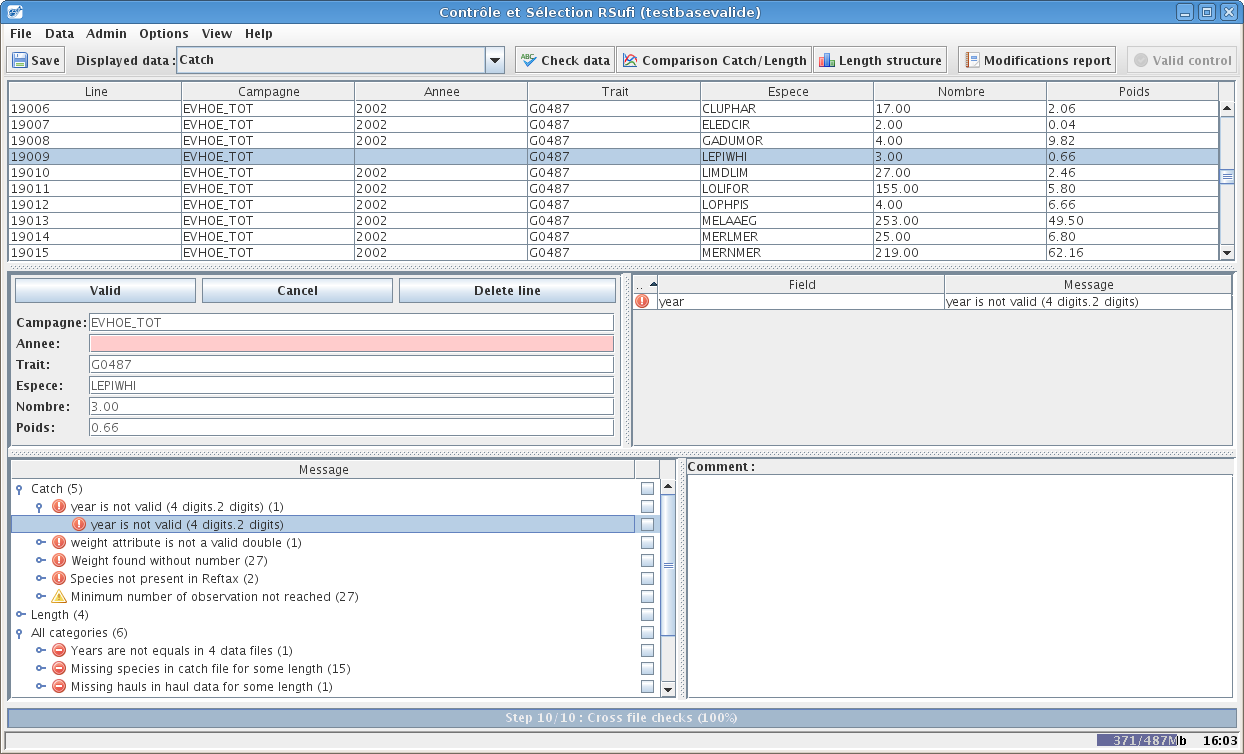
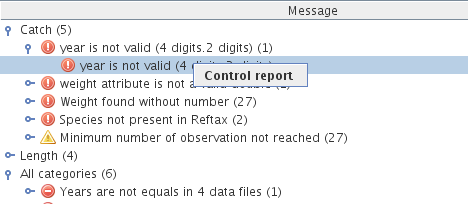
After the 10 verifications steps, a tree with all the detected errors is displayed.
For more information on the errors : controls list.
Correcting data (fixing errors)
When selecting an error, Coser displays the corresponding line of the data allowing you to correct it. The lines in red corresponds to the fields with detected errors. The right part details the error messages.
If for example the year is missing, the user can add it by hand and then validate the modification.
Bulk data correction
In the case of the same error on several lines :
either the error is caused by an export error of the 4 tables from the original data base and it is better to do the export again, bulk correction being impossible in coser.
or the errors can be corrected line by line.
The table that displays the data has a contextual menu allowing to :
delete several selected lines.
find a pattern and replace it by another one
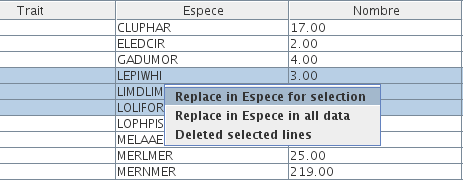
For example, if all numbers have a decimal comma (,) instead of a decimal point (.), it is possible to replace all commas by points in a single operation.
Charts
Coser generates figures to facilitate decision making (specifically for warnings).
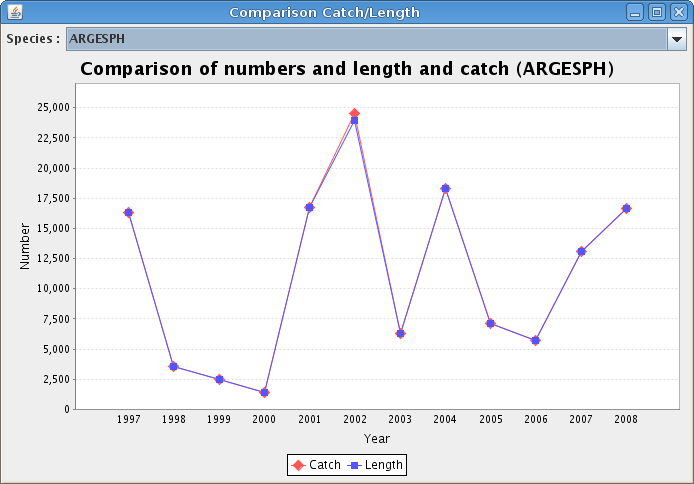
The button Comparison Catch/Length displays an interface where a figure is generated for each species. The data correspond to total ``Number``s per year in the catch and length files. A difference between the two values indicates an error in the original data, most likely caused during the raising procedure from the sub-sample to the haul level.
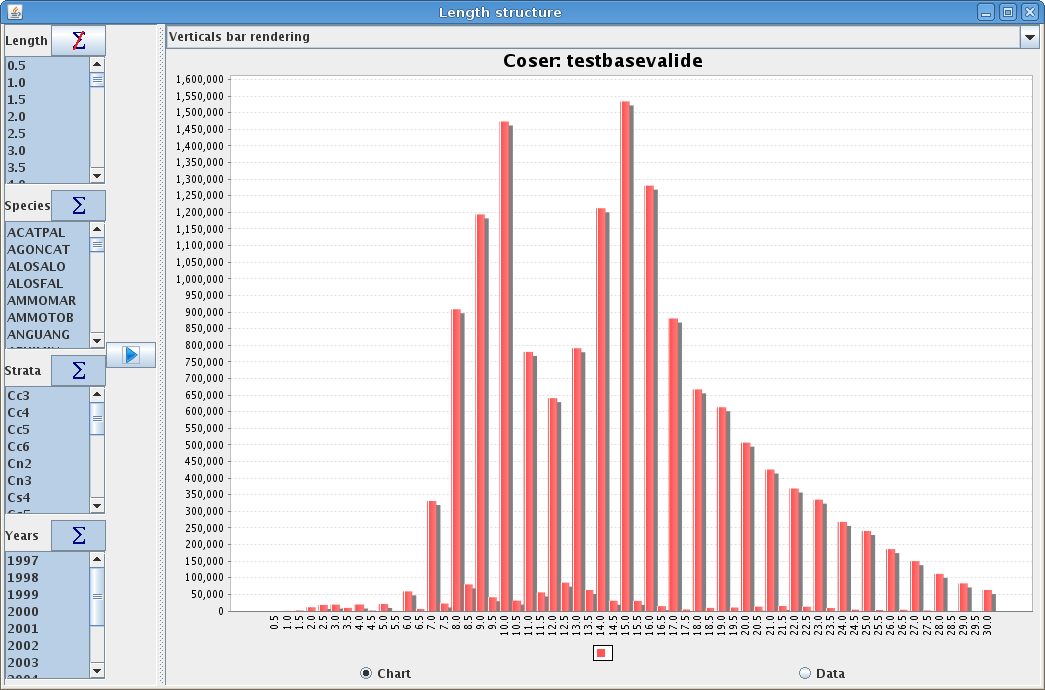
The button``Length structures`` displays an interface for generating figures for a data subset.
It is for example possible to display the length structure but only for a stratum, or a species, or cumulated…
Reports
In the control step, it is possible to generate two reports.
Save and validation
You can save the current state of the corrected data at any time.
After the data verification ended with no errors the Valid control button becomes active to validate the (corrected) data.
Validation of the control step is necessary to be able to move on to the selection step.